Sales Reports
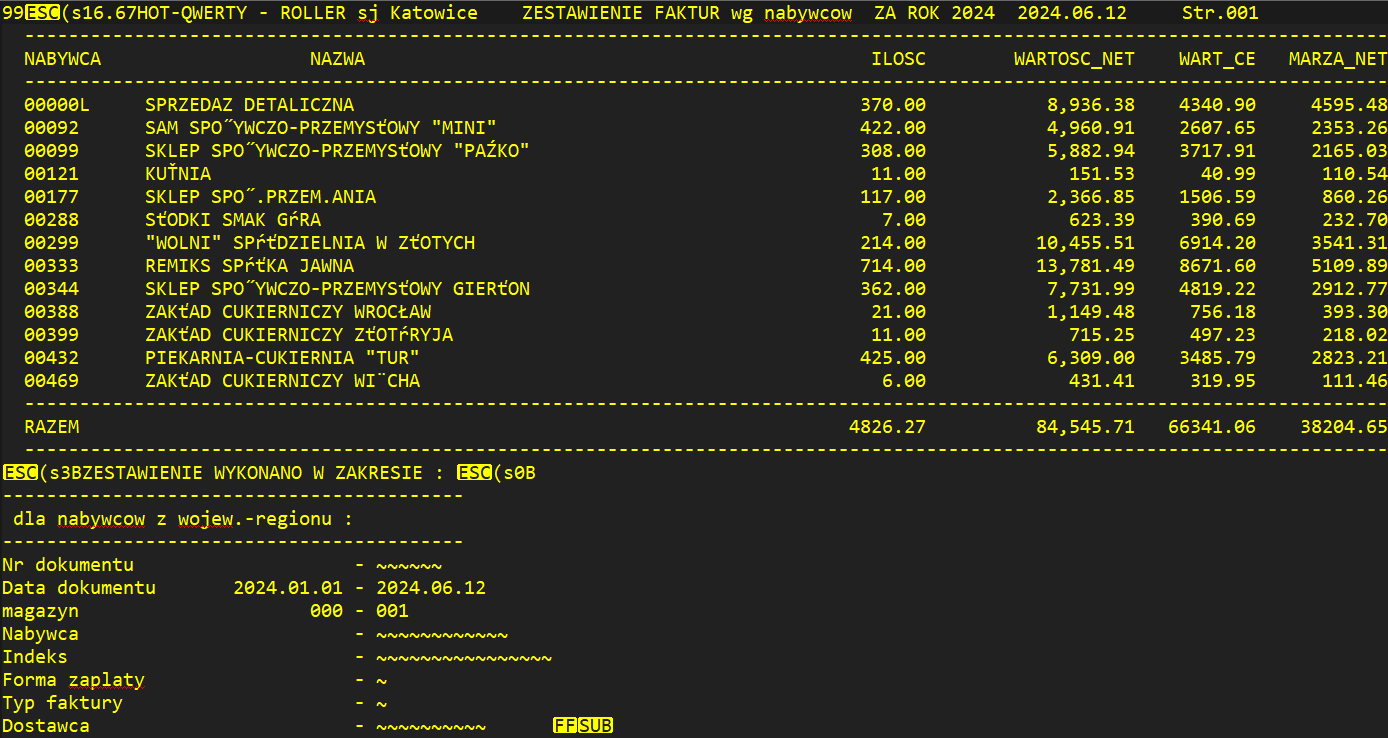
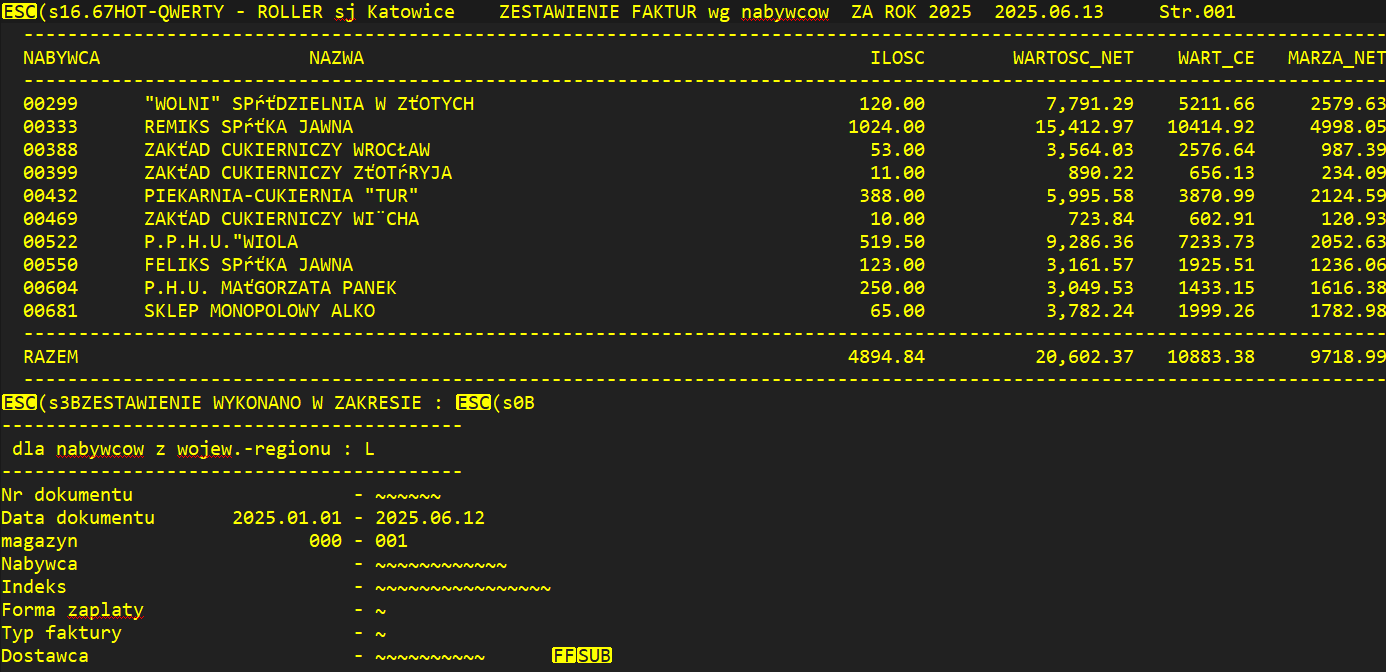
This tool is prepared individually for specific reports that the client receives from their system (text file, without tables, columns, or separators), example:
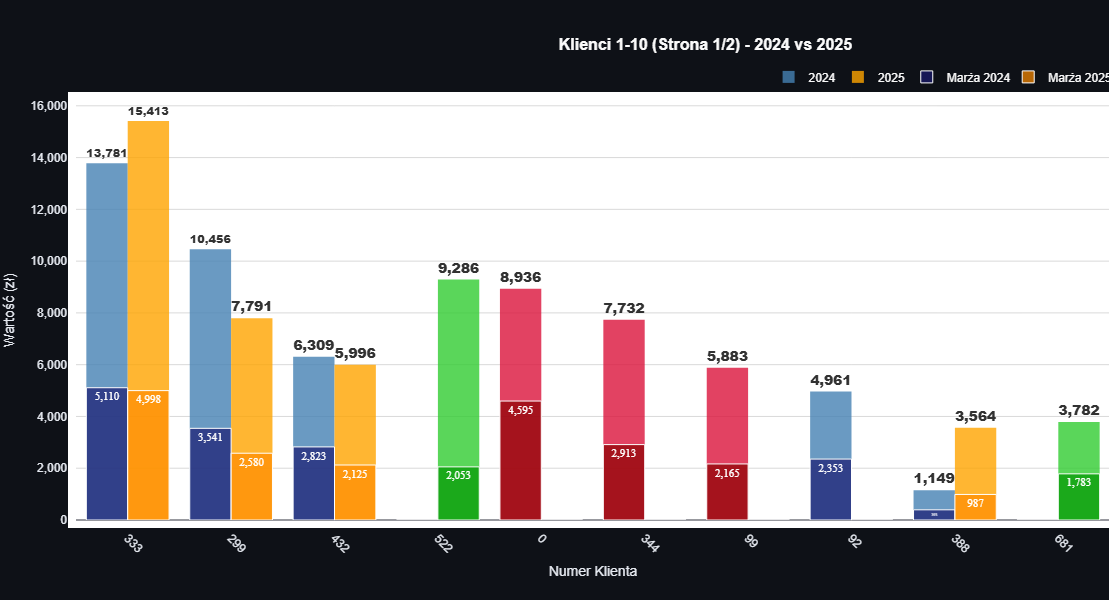
The result of the application is, for example, the following interactive chart
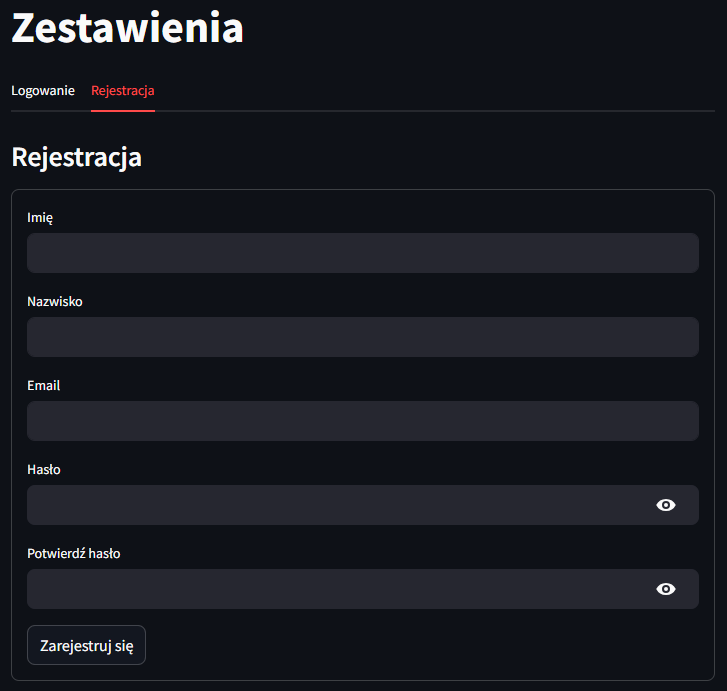
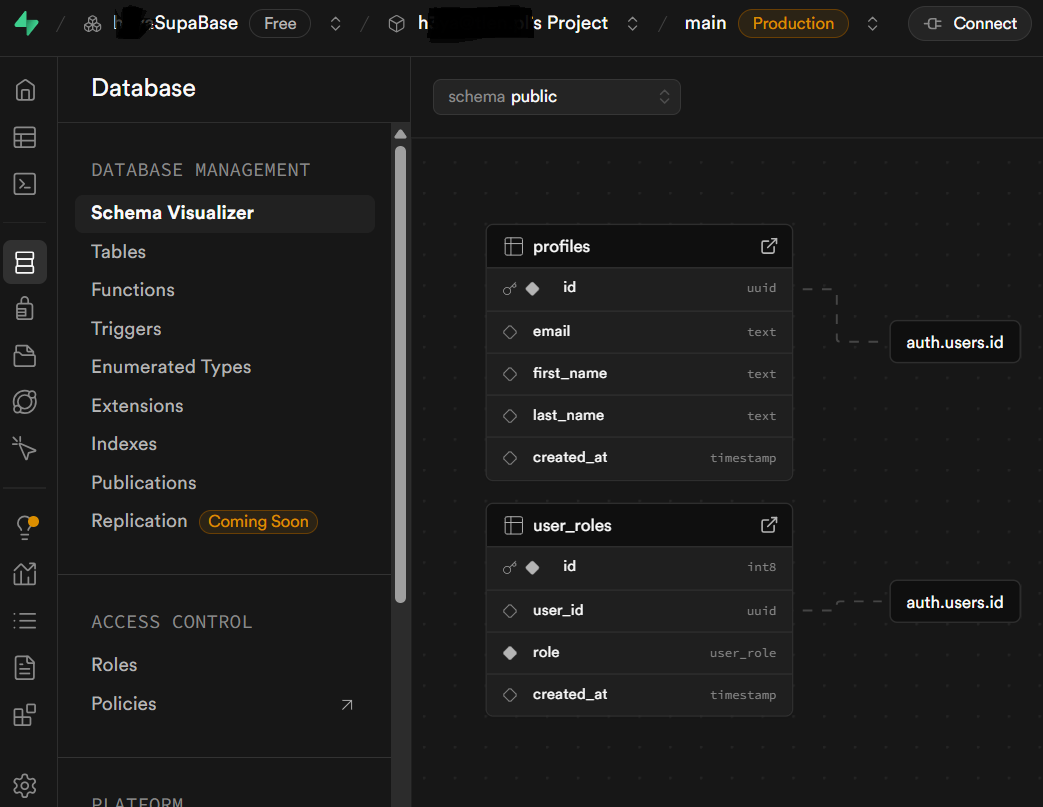
There is also a user registration and login system (Supabase Authentication), but it is disabled for presentation purposes. Example:
Technologies and Libraries Used
* Python
* Streamlit
* Pandas
* NumPy
* Plotly
* Supabase Storage
* Supabase Auth
* Github